Zarr-multiscales from GeoTiffs#
by Joe Hamman & Jeremy Freeman (CarbonPlan), September 27, 2021, Updated by Max Jones (CarbonPlan), 2024
This notebook demonstrates the production of Zarr data pyramids for use with @carbonplan/maps, an api for interactive multi-dimensional data-driven web maps.
Some of the libraries used here are in pre-release condition. Specifically
ndpyramid are currently undergoing rapid development. Use the
pattern below but expect changes to the specific apis.
All of the libraries used in this demonstration are included in this conda environment file.
import matplotlib.pyplot as plt
import pandas as pd
import xarray as xr

from ndpyramid import pyramid_reproject
VERSION = 2
LEVELS = 6
PIXELS_PER_TILE = 128
S3 = False
input_path = f"s3://carbonplan-maps/v{VERSION}/demo/raw"
if S3:
    base = f"s3://carbonplan-maps/v{VERSION}/demo/"
    store_2d = base + "2d/tavg"
    store_3d = base + "3d/tavg-prec"
    store_3d_1var = base + "3d/tavg-month"
    store_4d = base + "4d/tavg-prec-month"
else:
    import zarr

    store_2d = zarr.storage.MemoryStore()
    store_3d = zarr.storage.MemoryStore()
    store_3d_1var = zarr.storage.MemoryStore()
    store_4d = zarr.storage.MemoryStore()
2d (tavg)#
In this example we open a single 2d image (GeoTIFF) and create a Zarr pyramid.
%%time
# input dataset
path = f"{input_path}/wc2.1_2.5m_tavg_10.tif"
# open and extract the input dataset
ds = (
    xr.open_dataarray(path, engine="rasterio")
    .to_dataset(name="tavg")
    .squeeze()
    .reset_coords(["band"], drop=True)
)

# create the pyramid
dt = pyramid_reproject(ds, levels=LEVELS, clear_attrs=True)

# write the pyramid to zarr
dt.to_zarr(store_2d, zarr_format=2, consolidated=True)
CPU times: user 11.7 s, sys: 2.75 s, total: 14.5 s
Wall time: 45.3 s
3d, two variables (tavg and prec)#
In this example, we open two 2d images (temperature and precipitation), combine
them into a single array (along the band dimension), and create a Zarr
pyramid.
%%time
# input datasets
path1 = f"{input_path}/wc2.1_2.5m_tavg_10.tif"
path2 = f"{input_path}/wc2.1_2.5m_prec_10.tif"

# open and extract the input datasets
ds1 = (
    xr.open_dataarray(path1, engine="rasterio")
    .to_dataset(name="climate")
    .squeeze()
    .reset_coords(["band"], drop=True)
)
ds2 = (
    xr.open_dataarray(path2, engine="rasterio")
    .to_dataset(name="climate")
    .squeeze()
    .reset_coords(["band"], drop=True)
)
ds2["climate"].values[ds2["climate"].values == ds2["climate"].values[0, 0]] = ds1["climate"].values[
    0, 0
]
ds = xr.concat([ds1, ds2], pd.Index(["tavg", "prec"], name="band"))

# create the pyramid
dt = pyramid_reproject(ds, levels=LEVELS, other_chunks={"band": 2}, clear_attrs=True)

# write the pyramid to zarr
dt.to_zarr(store_3d, zarr_format=2, consolidated=True)
CPU times: user 15.6 s, sys: 2.15 s, total: 17.7 s
Wall time: 21.9 s
3d, one variable, multiple time points#
In this example, we open 12 2d images (one map of temperature for each month),
combine them into a single array (along the month dimension), and create a
Zarr pyramid.
%%time
# open and extract the input datasets
ds_all = []
months = list(map(lambda d: d + 1, range(12)))
for i in months:
    path = f"{input_path}/wc2.1_2.5m_tavg_{i:02g}.tif"
    ds = (
        xr.open_dataarray(path, engine="rasterio")
        .to_dataset(name="tavg")
        .squeeze()
        .reset_coords(["band"], drop=True)
    )
    ds_all.append(ds)
ds = xr.concat(ds_all, pd.Index(months, name="month"))

# create the pyramid
dt = pyramid_reproject(ds, levels=LEVELS, other_chunks={"month": 12}, clear_attrs=True)

# write the pyramid to zarr
dt.to_zarr(store_3d_1var, zarr_format=2, consolidated=True)
CPU times: user 1min 23s, sys: 15.9 s, total: 1min 39s
Wall time: 2min 40s
4d, multiple variables, multiple time points#
In this example, we open 12 2d images for 2 variables (one map of temperature
and precipitation for each month), combine them into a single array (along the
month and band dimensions), and create a Zarr pyramid.
%%time
# open and extract the input datasets
ds1_all = []
ds2_all = []
months = list(map(lambda d: d + 1, range(12)))
for i in months:
    path = f"{input_path}/wc2.1_2.5m_tavg_{i:02g}.tif"
    ds = (
        xr.open_dataarray(path, engine="rasterio")
        .to_dataset(name="climate")
        .squeeze()
        .reset_coords(["band"], drop=True)
    )
    ds1_all.append(ds)
ds1 = xr.concat(ds1_all, pd.Index(months, name="month"))
for i in months:
    path = f"{input_path}/wc2.1_2.5m_prec_{i:02g}.tif"
    ds = (
        xr.open_dataarray(path, engine="rasterio")
        .to_dataset(name="climate")
        .squeeze()
        .reset_coords(["band"], drop=True)
    )
    ds2_all.append(ds)
ds2 = xr.concat(ds2_all, pd.Index(months, name="month"))
ds2["climate"].values[ds2["climate"].values == ds2["climate"].values[0, 0, 0]] = ds1[
    "climate"
].values[0, 0, 0]
ds = xr.concat([ds1, ds2], pd.Index(["tavg", "prec"], name="band"))

# create the pyramid
dt = pyramid_reproject(
    ds, levels=LEVELS, extra_dim="band", other_chunks={"band": 2, "month": 12}, clear_attrs=True
)
dt.ds.attrs

# write the pyramid to zarr
dt.to_zarr(store_4d, zarr_format=2, consolidated=True, mode="w")
CPU times: user 2min 9s, sys: 27.9 s, total: 2min 37s
Wall time: 3min 5s
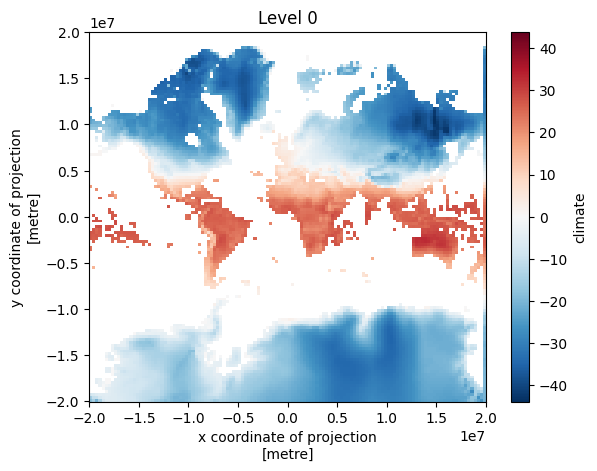
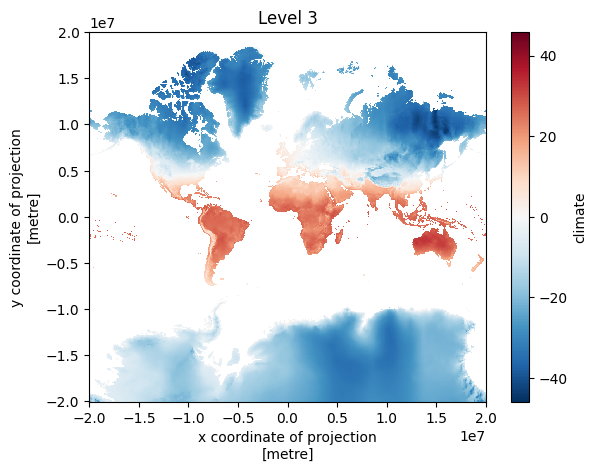
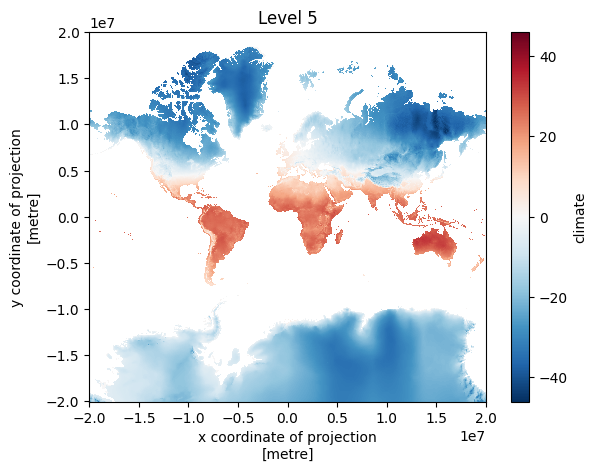
Plot the first time step at each level#
for level in range(LEVELS):
    fig, ax = plt.subplots()
    dt[str(level)].ds.isel(band=0, month=0).climate.plot()
    ax.set_title(f"Level {level}")